Ticketmaster Resale
- Product_Design
- Data_Visualization
- Interactive_Prototyping
The Problem: Season ticket holders needed a better way to resell their tickets to the general marketplace. Over 90% of sports and theatre season ticket holders resell tickets during the season, but most were changing their price several times after listing.
The Solution: A complete rethinking of the resale experience to provide sellers with better ticket price data to inform their sell price.
The Results: Sell through rate of tickets increased by 13%, resulting in $40M gross transaction value. In addition, season ticket holders edited their listings half as much after pricing their tickets more accurately from the beginning.
A Fresh Start
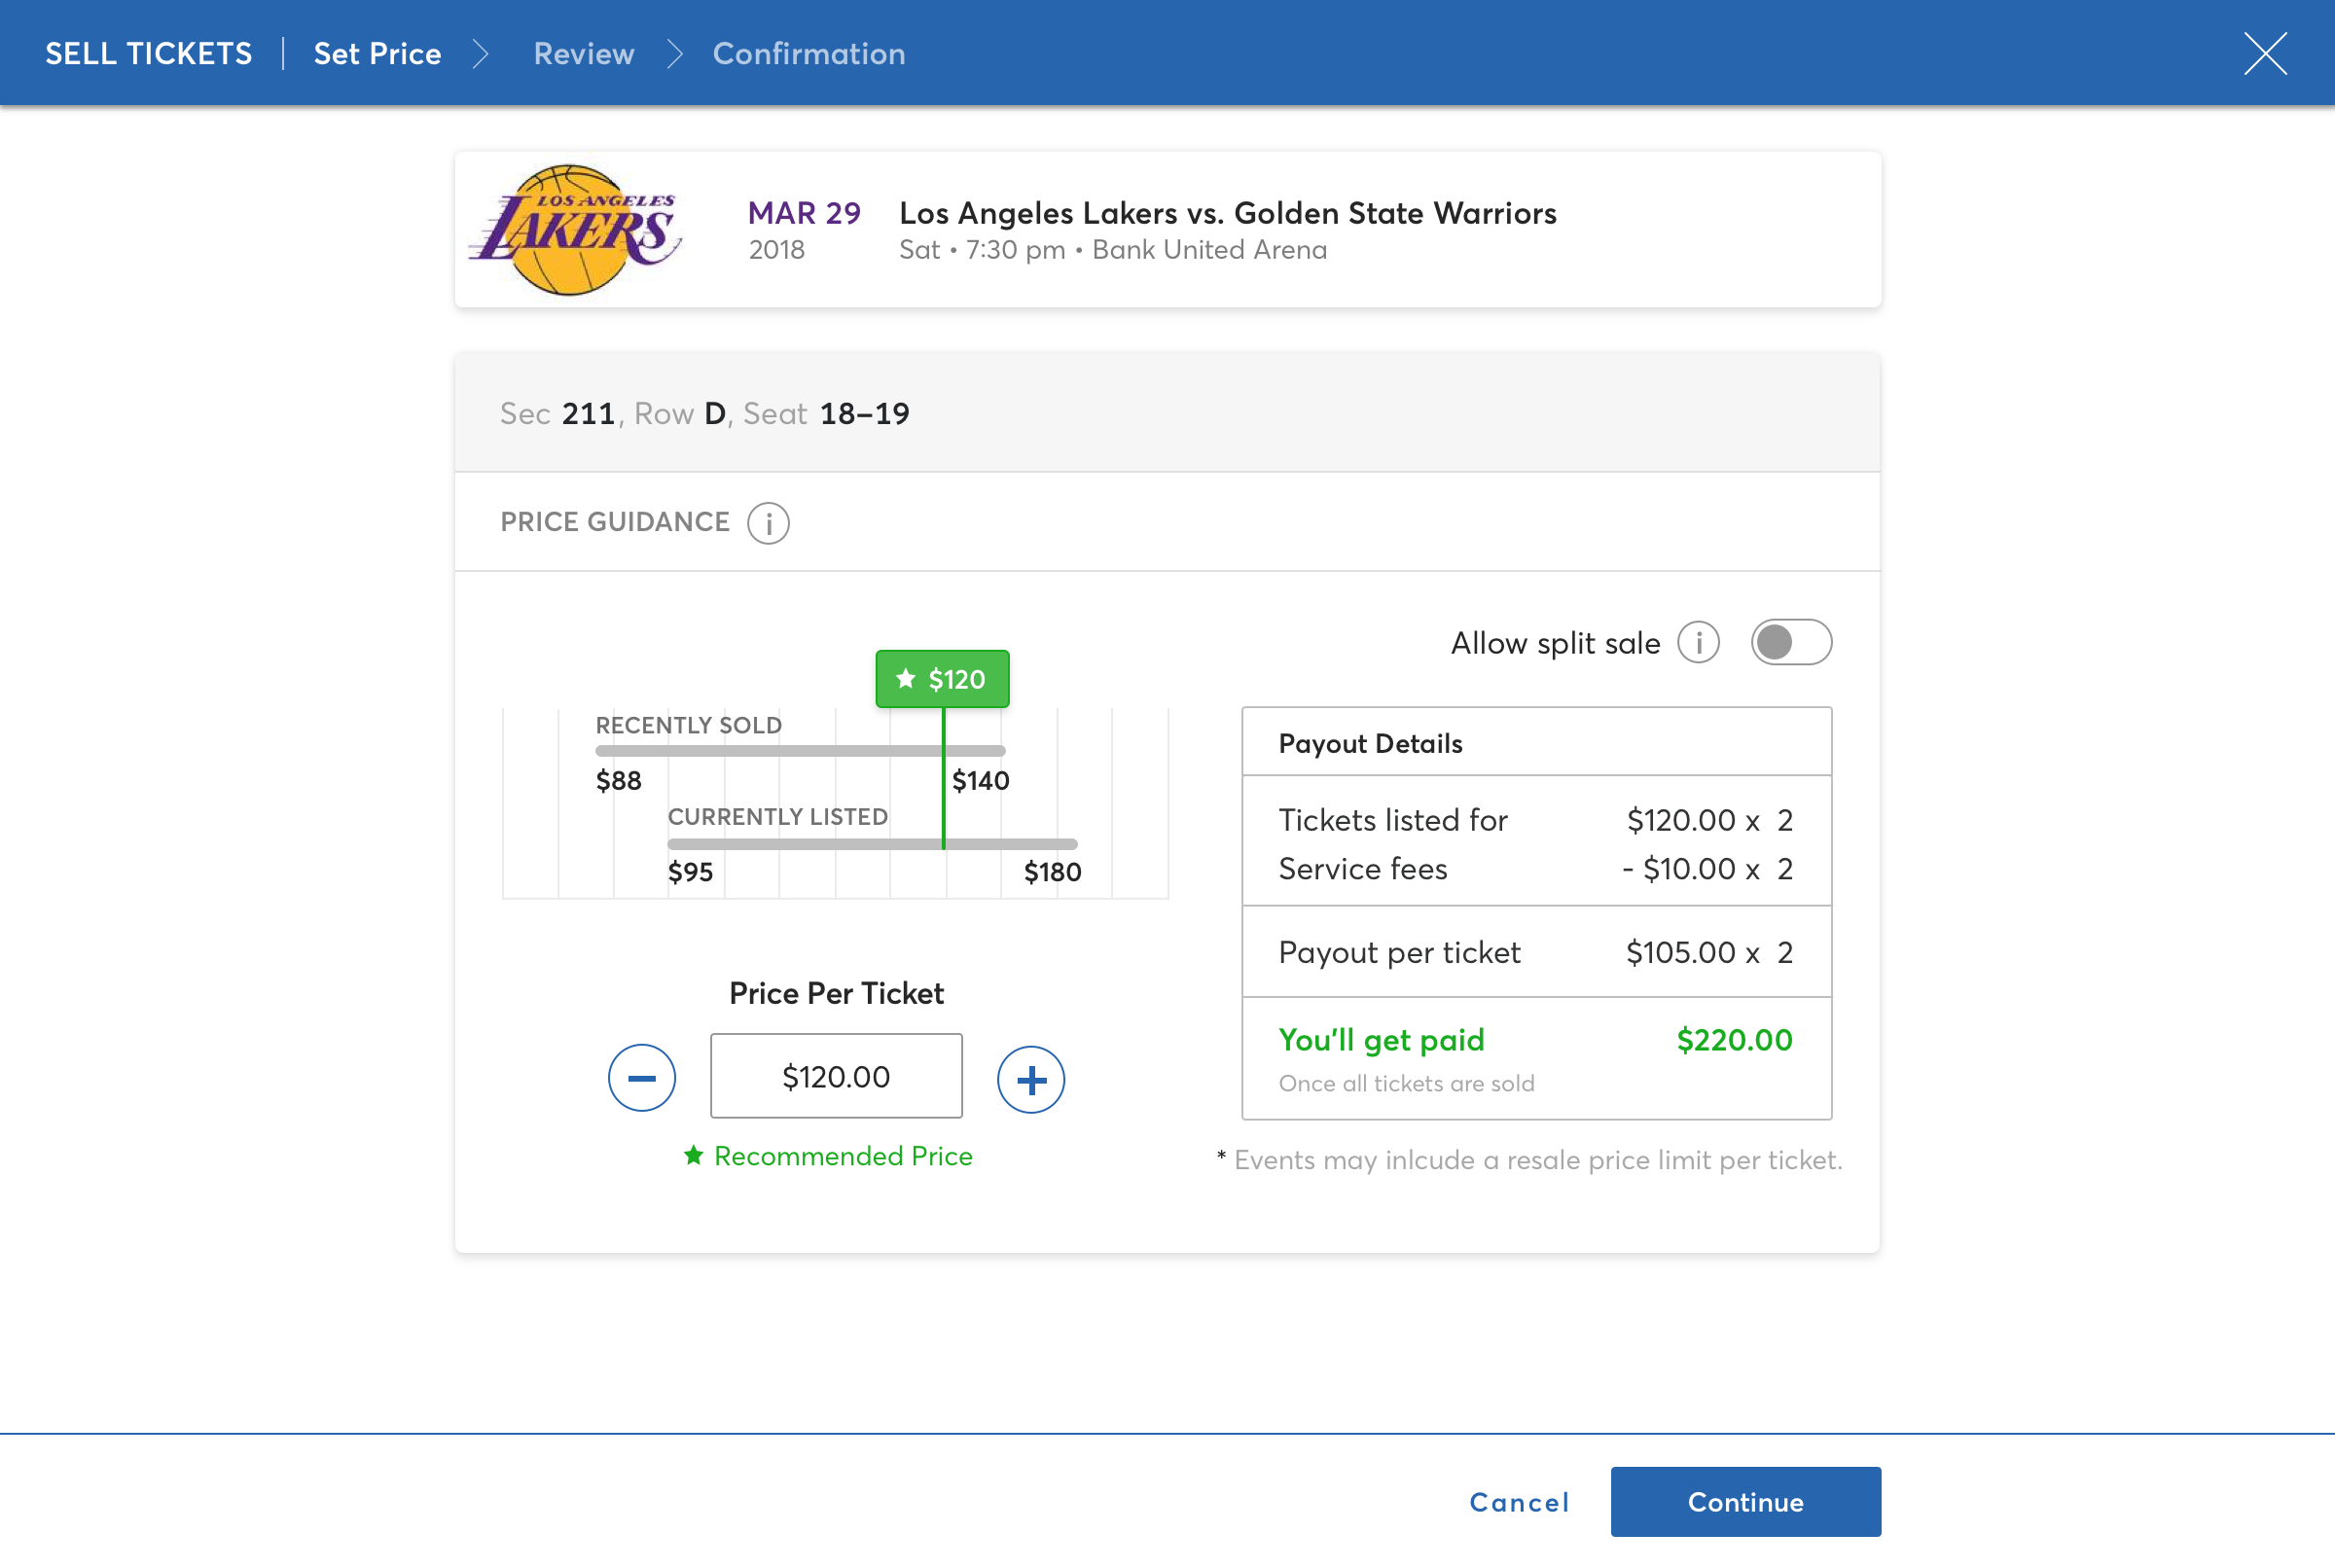
The previous Resale iteration was a cumbersome three screen modal. Fans had to complete numerous extraneous steps in order to move forward to the next screen, even if they’d sold tickets before. It was also designed as a mobile first experience. In looking at our analytics we realized that, although most other products were predominantly viewed on mobile devices, Resale traffic was accessed on desktop nearly 80%.
Another realization gleaned from analytics was many users instinctively clicked on the pricing graph, although it was not interactive. These insights informed our initial design direction.
Previous Design
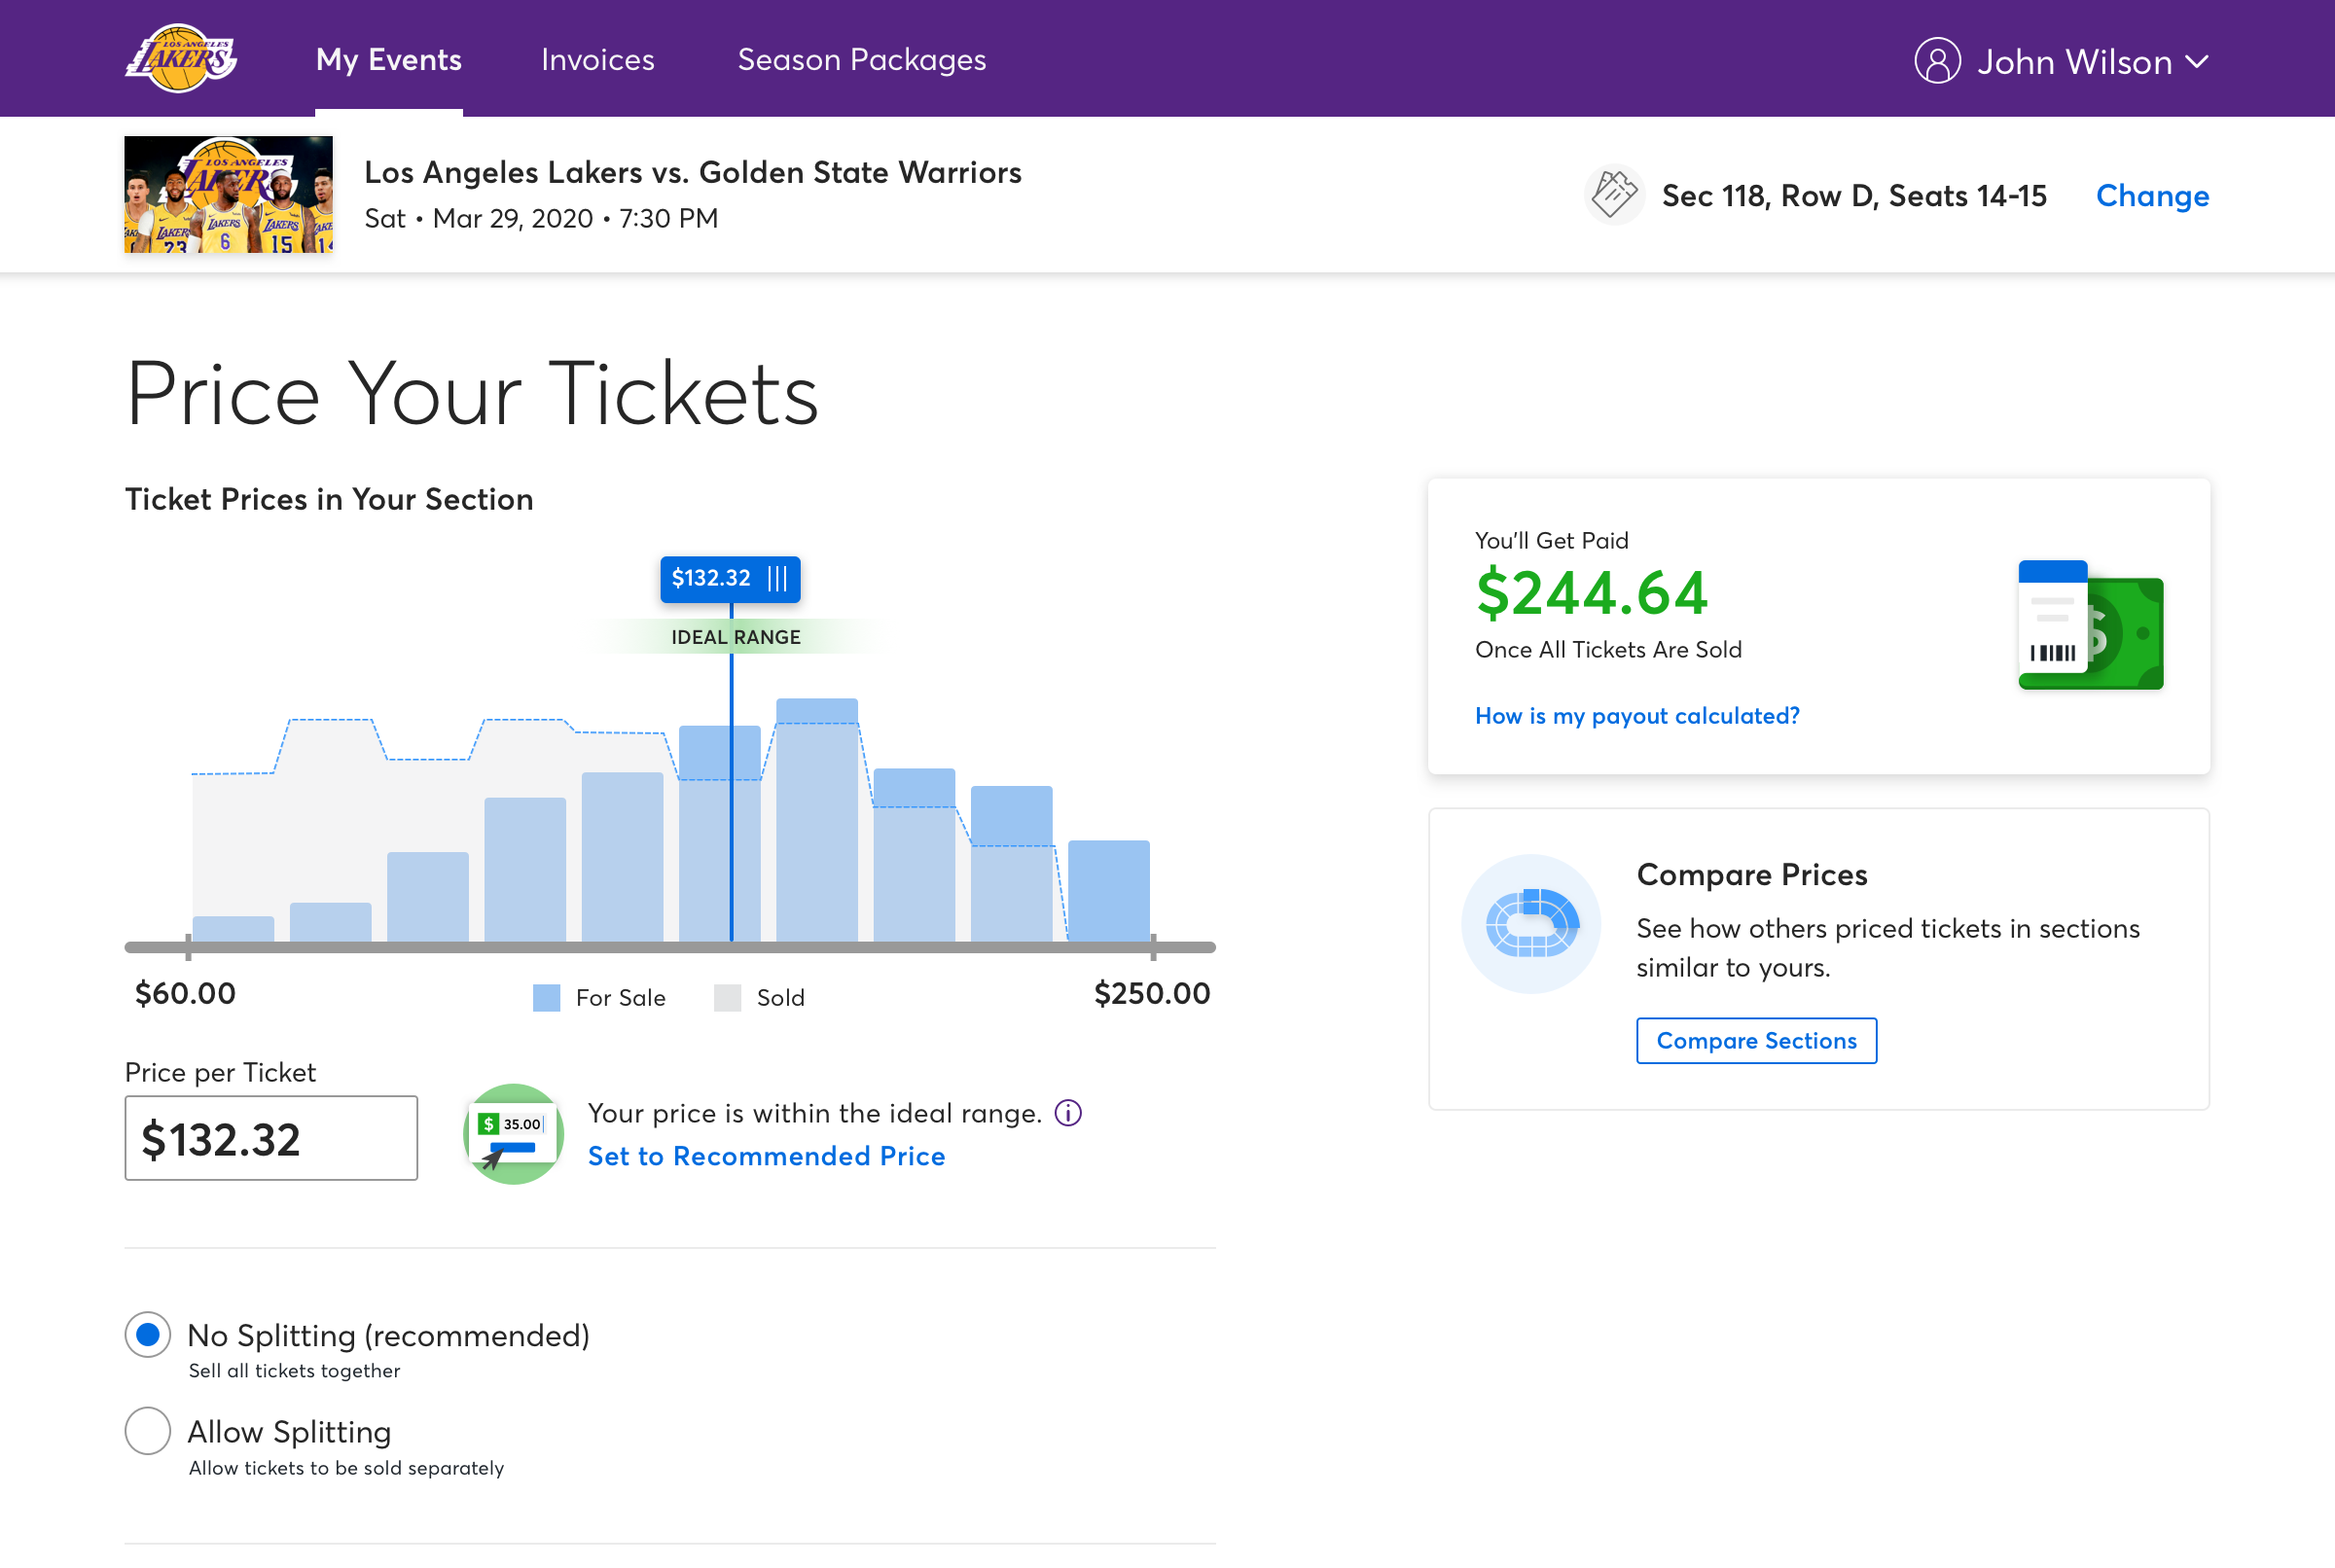
New Design
Putting It to the Test
Early in the design process we knew we wanted to validate some key interaction assumptions before diving too deep into design. Because traditional clickable prototypes like Invision wouldn't suffice in mocking up complex interactions, I chose Framer to build the interactive prototype. Framer allowed us to quickly mockup interactions without coding a full site. Since Ticketmaster’s design system is React based, we quickly imported the actual components into Framer for realistic design and interactivity.
After several testing sessions with season ticket holders we were able validate our assumptions and gain a better understanding of what future features fans would like to see.
Bringing It All Together
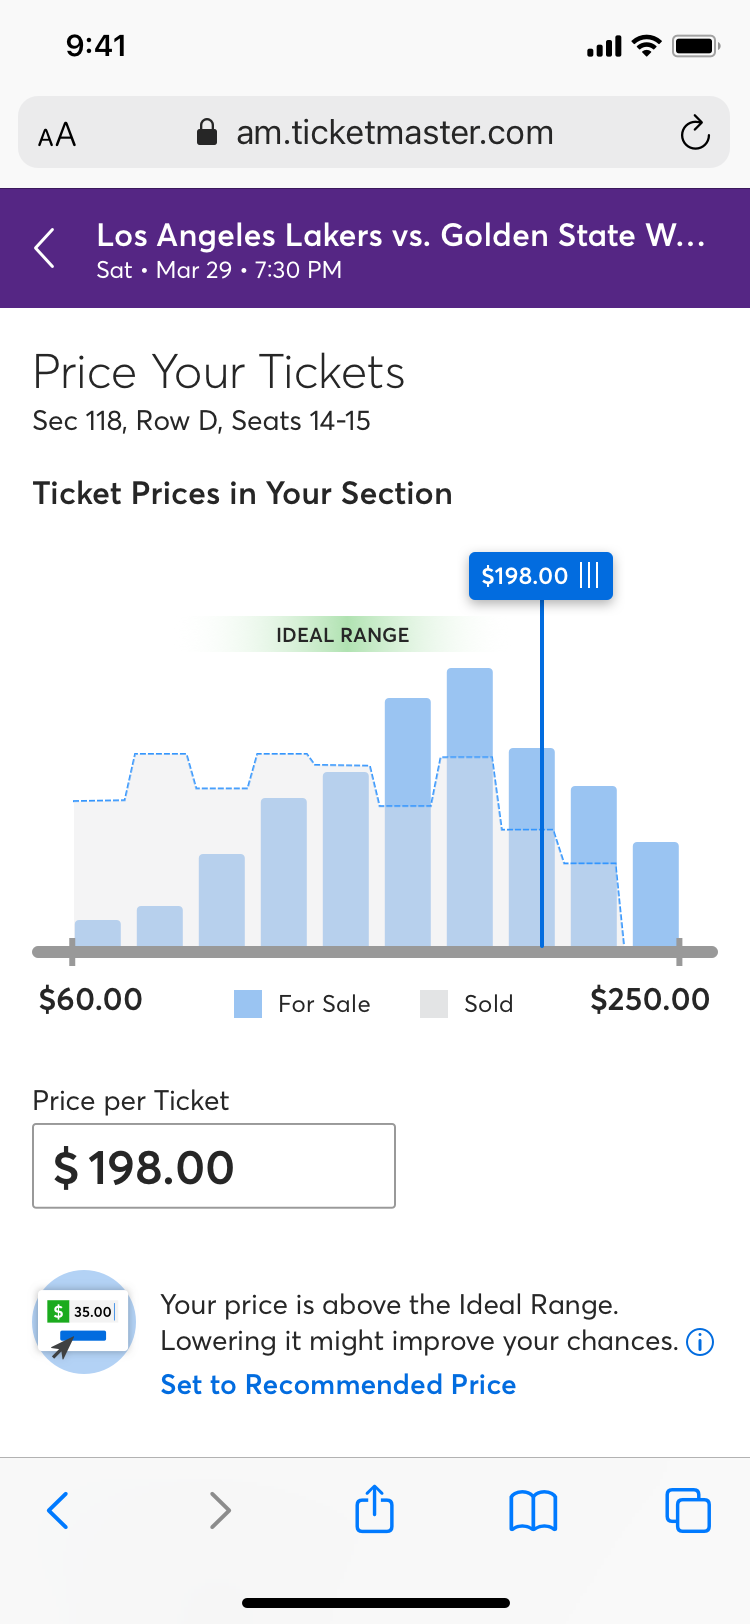
Surfacing current and historical pricing for tickets in a section was paramount. We developed an interactive graph that allows sellers to easily adjust their price by moving a slider. Feedback information on price suggestions then corresponds to the listing price, letting sellers know the likelihood of a ticket being sold.
During research we found that most season ticket holders often have several different ticket resale sites open to gauge what the going prices are for comparable stadium sections. For the redesign, we wanted to bring this feature into the experience by adding a section selector map that lets sellers add comparable sections to their pricing graph.
Because of the large variance in the amount of pricing data, we worked with our internal Data and Machine Learning teams to tune the pricing graph so it provides valuable feedback, even with vastly different sets of data.
Future enhancements based on artificial intelligence and machine learning will be able to automatically adjust the price for the seller (within their parameters) and provide better pricing data. Factors like team ranking, weather, and media attention will help adjust the data model.